The Top 300+ Local SEO Statistics, Updated 2026
Share


Local SEO is no longer simply about ranking on a map; it’s about being visible everywhere a customer looks, from AI answers to the videos and social feeds that now decide who gets found and who gets forgotten. Those signals also reinforce your brand and authority, driving a positive feedback loop of visibility.
A customer looking for a local business may spot it in several places before deciding what to do: a search result, a Google Maps listing, a review, a social post, an LLM answer, or anywhere else businesses show up. Each touchpoint can shape whether they trust the business and take the next step, from requesting directions to making a booking.
Understanding local visibility means looking across those touchpoints rather than treating SERP rankings as the whole story.
This collection brings together local SEO statistics available in 2026, prioritizing original research with clear dates, sample sizes, and geographic scope. We distinguish consumer behavior data, like what people say they do or how they search, from business performance data, such as calls, visits, leads, and sales. Each measurement answers a different question, and so each measurement needs to be considered based on its source and methodology.
Consider this your prime data set to argue for a revamped local SEO strategy this year, following current trends and best practices.
AI has changed local search behavior
AI has turned local search from a list of options within walking or driving distance into a direct recommendation: customers now ask a question, get an answer to what they need right now, and often choose a business without even clicking through a website.
Beneath that shift is something even more fundamental for SEO: searching locally has become a universal habit, the reflex driving people to reach for their smartphone whenever they need something nearby. That reflex carries intent. Someone searching locally has already decided to act, but now they’re choosing who gets the call, the visit, or the booking.
Brightlocal recently calculated that 97% of people scope out a business’ digital presence before choosing to buy from them.
What does anyone mean by “digital presence”? Local discovery sheds light on the answer–or, rather, on all the surfaces that are part of this answer. Consumers use lots of different channels: 83% search for local businesses, 55% browse social media profiles, and a growing 52% use AI to ask for local businesses that meet their needs. In 2026 it’s clear that every local business, big or small, needs to invest in how they show up online.
Here at SOCi, we’ve actually broken it down into three stages before a customer chooses you:
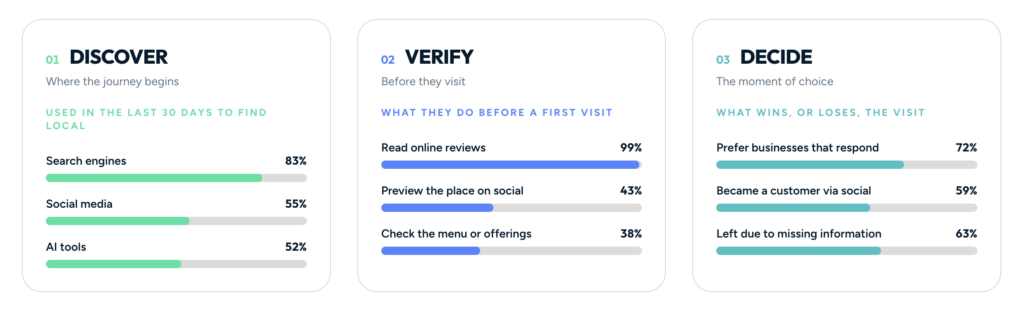
Since 2025, use of AI to discover local business has increased by over 500%, with 40% of customers saying they use AI more. This has been a growing dimension for all businesses to try and gain visibility.
But depending on the demographic you’re trying to reach, this gets more interesting–and there’s more data than ever that you can use to adjust your marketing efforts.
It turns out that as household income increases, so does the use of AI to discover local businesses. Only 47% of households under $50K use AI regularly, while 76% of households earning $100K each year consistently use AI tools (and that percentage continues to grow year after year).
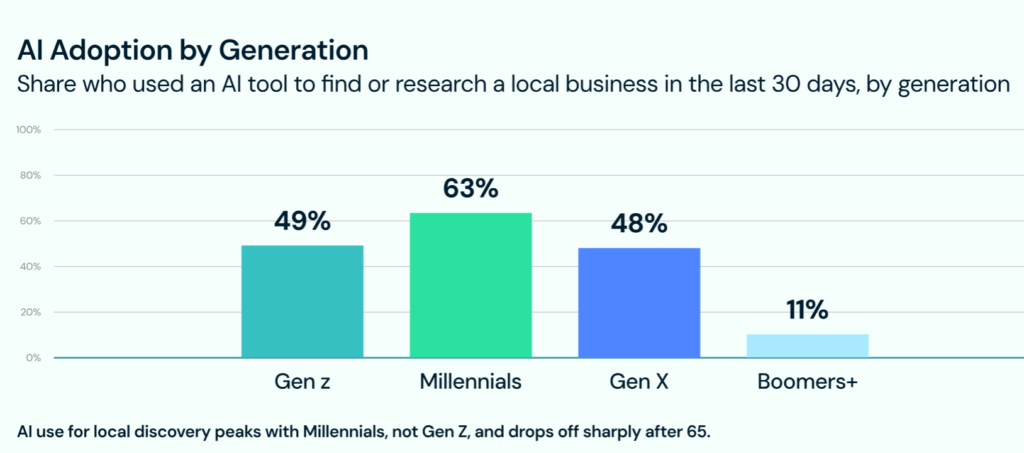
Curious about AI use by age group? A whopping 63% of millennials have used an AI tool to research local businesses within the last month, while only 49% of Gen Z and 48% of Gen X can report the same.
Does this search traffic and suspected intent turn ino meaningful customers? The answer is likely yes. According to Google, 76% of people who search “near me” end up visiting a business within the next day, while 88% of people who use a smartphone for a local search visit a store. Backlinko reports that 2 in 10 local searches made on a smartphone end in a purchase within twenty-four hours.
If you’re wondering whether it’s worth investing in your local search presence, the answer is definitely yes.
Google Maps and Google Business Profiles
A major part of local SEO is getting your Google Business Profile (GBP) shown and chosen in Google Maps. Maps is no longer just how people get somewhere; it’s where they decide where to go and who to hire, and your GBP is what it reads to answer them. The same GBP feeds AI Overviews and Gemini.
Three shifts define local SEO this year.
- Maps has gone conversational. With Gemini built in, people ask full questions (“Who can fix my boiler tonight?”) instead of typing keywords, and the answer is assembled from your categories, services, attributes, and review text.
- Impressions are falling while high-intent actions like calls, direction requests, and bookings hold steady.
- The basics have become the differentiator: completeness, accuracy and review freshness increasingly decide which businesses get shown and chosen.
Maps usage and discovery
Scale. Google Maps has more than 2 billion monthly users and is the world’s leading navigation app, which makes it the largest single audience local SEO can reach. Its community input is just as large: in 2025 alone, users contributed more than 1 billion reviews and suggested 80 million updates to business hours, contact details and other information. Industry estimates put global GBP listings at roughly 225–230 million in 2026, up about 6–7% year over year, with the US accounting for around 39–42 million, or about 18% of the total.
With that many profiles competing for the same local queries, having a listing is only the first step. Your local SEO work needs to involve keeping yours complete, accurate, and current.
Discovery is non-branded. Most people who find a business on Maps weren’t looking for it by name. In fact, 84% of Google Business Profile visits come from unbranded discovery, not direct search. The average SMB profile receives about 1,009 searches a month, of which 781 are discovery views and only 228 are direct. Local intent is widespread, with an estimated 46% of all Google searches carrying local intent in 2026.
For SEO, the takeaway is that roughly three in four profile views come from people who searched for a category, service, or “ near me” term rather than the business’ name. These are the searchers who haven’t chosen a provider yet, and whether a business appear in front of them depends on local ranking signal.s
Maps is now AI-driven. Google launched Ask Maps, a Gemini-powered conversational feature, on March 12, 2026. It replaced the old Q&A function and changes how customers find local businesses. Google says it analyzes information from more than 300 million places, including reviews from over 500 million contributors, to generate personalized recommendations. This means the content written in customer reviews (and not just the star rating) matters for your local SEO.
The rollout has been fast. After launching in the US, Ask Maps began expanding in August 2026 to Australia, Brazil, Canada, Indonesia, Japan, Mexico and more than 150 countries and territories. Profile content now feeds these AI answers directly. Posts, products and offers now inform the Maps place summary, alongside reviews and the profile description.
Fewer impressions, stable actions. This is the most important 2026 shift for anyone measuring GBP performance. According to Birdeye, impressions per location fell 53.8% while customer actions dropped only about 5%. The profiles still being shown are reaching more qualified, intent-driven searchers. The practical SEO implication: measure and judge GBP performance by calls, direction requests and clicks, not by impressions.
Google is dominant but no longer the only stop. BrightLocal’s 2026 consumer survey found Google’s share as a review source dipped from 83% in 2025 to 71%. Meanwhile, use of ChatGPT and other generative AI tools for local recommendations rose from 6% to 45%, making them the third most popular source, and Apple Maps nearly doubled in usage, from 14% in 2025 to 27%. The average consumer now uses six different review sites when choosing a business.
LLMs draw on directories, review sites, and the business website for their information, making it imperative to maintain consistent business details across the web. For a period of time some advanced SEOs were a bit dismissive of the importance of “NAP consistency,” but that’s not the case anymore.
Profile completeness, prominence, and customer action
Google ranks local results on three factors: relevance, distance, and prominence. Relevance is how closely a profile matches what someone searched for. Prominence is how well known and well regarded the business is, which Google gauges from reviews, links, and activity. A complete profile helps with both of these, and the data consistently shows that complete profiles get more customers to act.
Claiming a profile is the baseline; completeness is where brands fall short. In SOCi’s Local Visibility Index, 97.9% of multi-location brand locations have claimed their GBP, but completeness averages only 86.6%, a slight decline from 2024. SOCi attributes the drop to growing platform complexity. It varies by industry: restaurant locations average 94.2% completeness, retail 86.4% and financial services 81.4%. SOCi puts the benchmark bluntly: brands with less than 97% of locations claimed are already behind.
A business can’t change how far it is from the people searching, and so in practice local SEO is the work of improving relevance and prominence. Profile completion feeds both, and as you’ll see the data points to these profile details tying directly into customer action.
Completeness builds trust and drives visits. Google’s own benchmarks, still widely cited in 2026, say consumers are 2.7x more likely to consider a business reputable if it has a complete Business Profile on Search and Maps. Complete profiles are also 50% more likely to be considered for purchase.
Best-in-class examples show the payoff. SOCi’s top performers pair near-perfect profiles with outsized visibility:
- Batteries Plus Bulbs: 99.1% of profiles claimed and 99.1% complete. Its locations appear in the 3-Pack 92.3% of the time, against a 49.5% retail benchmark.
- Culver’s: 100% of profiles claimed and complete, with 57.7% 3-Pack visibility against a 24.3% restaurant benchmark. Its AI recommendation rates are 30.0% on ChatGPT and 45.8% on Gemini, compared with category averages of 5.3% and 7.1%.
- Liberty Tax: 68.3% 3-Pack visibility against a 44.0% financial services benchmark.
The same leaders are also fast on reviews. Batteries Plus Bulbs responds to 98.3% of its Google reviews, with an average response time of 0.6 days.
Ranking well on Google doesn’t guarantee AI visibility. Fewer than half of the brands that lead in traditional local search also appear among the top AI recommendations. In retail, only 45% of the top 20 search brands also rank in the top 20 for AI. AI platforms look for consistent signals across many sources, so a location with strong Google rankings but a weak presence on Yelp, Facebook or its own website often loses out.
Ratings now act as a filter. Locations recommended by AI platforms average 4.2 to 4.3 stars. SOCi argues that reviews are shifting from a ranking factor to a threshold for inclusion: a business with merely good ratings may still rank in traditional search but is less likely to be surfaced by AI.
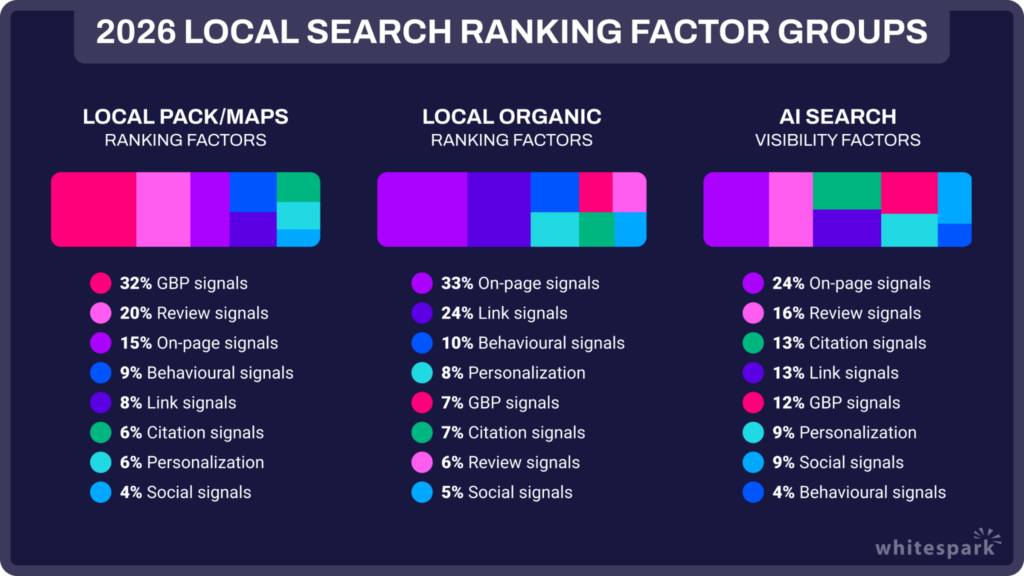
GBP dominates the ranking factors. In Whitespark’s 2026 Local Search Ranking Factors survey, 8 of the top 10 Local Pack/Maps factors come directly from the GBP. Experts also rank a business being open at the time of the search as the fifth most influential Local Pack/Maps factor, so accurate hours matter as much for ranking as for customer experience. The survey added AI visibility for the first time and found that 3 of the top 5 AI Search visibility factors are citation factors, meaning consistent business details across the web.
Enforcement protects genuine profiles and punishes shortcuts. Google’s 2025 Trust & Safety Report says the company blocked or removed more than 292 million policy-violating reviews, blocked 79 million inaccurate or unverified edits, and removed over 13 million fake Business Profiles. In April 2026, Google added rules that explicitly bar merchants from directing staff to solicit a set number of reviews, or reviews that mention staff names or other specific content.
When Google detects a spike in spam reviews, it now pauses new reviews and shows consumers a public banner explaining the pause. A pause can therefore cost more than a few days of lost reviews, since you can lose authority and respect while competitors rapidly snatch up the difference. Ask for reviews continuously, not in batches, stay inside Google’s policies, and be sure to monitor every location.
Local SEO performance
Local SEO in 2026 is a contest across three surfaces that each rank businesses differently: the map pack, the localized organic results, and AI-generated answers. The map pack still dominates high-intent local searches, but fewer searches send clicks anywhere. That makes website content, consistent citations and good measurement more important, not less.
Organic versus map results for local queries
The map pack still owns high-intent local searches. For classic local-intent queries like “plumber near me” or “dentist Phoenix,” the local pack appears on roughly 93% of results. Whitespark’s most recent measurement (2025) found AI Overviews on only 15% of strictly local-intent queries, compared with 92% of informational queries that mention a location. Whitespark’s Darren Shaw argues that local search has been relatively sheltered from the AI upheaval: people still research local businesses mainly through Google’s local results, because they serve local intent better than LLM answers do.
But organic search’s clicks are scarcer overall. SparkToro and Similarweb found that 68.01% of US Google searches in January–April 2026 ended without a click, up from 60.45% in 2024. Put another way, only about 276 of every 1,000 US Google searches now send a click to the open web, down from 374 in 2024. Where AI Overviews do appear, they hit organic clicks hard. Ahrefs’ February 2026 study of 300,000 keywords found a 58% click-through drop for top-ranking pages when an AI Overview was present, up from 34.5% in April 2025. A randomized field experiment published in 2026 found AI Overviews caused a 39.8% drop in organic clicks and pushed the zero-click share from 54% to 72%. AI Mode is still a small factor: it handled just 0.34% of searches in the study period.
Ranking #1 isn’t enough on its own. BrightLocal’s 2026 Consumer Search Behavior study (1,227 US consumers) found that 72% look at three or fewer businesses before deciding, so being in the top three matters. Yet only 6% say they simply clicked the top result. Where a business ranks was only the eighth most important factor during research (16%). Proximity came first (44%), followed by star rating (38%), number of reviews (37%) and whether the listing had complete information (34%).
Map and organic rankings measure different things. In Whitespark’s 2026 Local Search Ranking Factors survey, the top map pack factors are primary GBP category, proximity to the searcher, and keywords in the GBP business title. The top localized organic factors are almost entirely website signals: a dedicated page for each service, geographic keyword relevance in the content, and the quality and authority of inbound links. One analysis of the survey puts on-page signals at about 33% and links at about 24% of localized organic ranking weight, which makes organic a very different ranking problem from the map pack.
Benchmarks from real brands. SOCi’s 2026 Local Visibility Index found multi-location brand locations appear in the Google 3-Pack 35.9% of the time, but only 2.7% of their local landing pages reach page 1 of Google. That gap between pack visibility and organic page visibility is the biggest missed opportunity in the data. It also varies by industry:
| Industry | 3-Pack presence | Local pages on page 1 |
| Retail | 49.5% | 22.6% |
| Financial services | 44.0% | 6.7% |
| Restaurants | 24.3% | 7.8% |
Paid placements take clicks from both. In categories with Local Services Ads, those ads dominate the top of the page and draw a large share of clicks away from both the pack and organic results. Whitespark reports personal injury clients who rank very well in both local and organic results but still get 70% of their cases through Local Services Ads.
The role of website content, location pages, citations, and links
Website content: specific and concise beats long. Whitespark’s 2026 survey ranks having a dedicated page for each service as the #1 localized organic factor and #24 for the map pack. Long-form content is falling out of favor: “volume of quality content on service pages” dropped 40 places in the rankings, and Shaw’s advice is to write clear, concise content that answers the user’s question without filler. He notes that this also helps in AI search. The survey also debunked a common myth: title tag length scored near the bottom of all 187 factors.
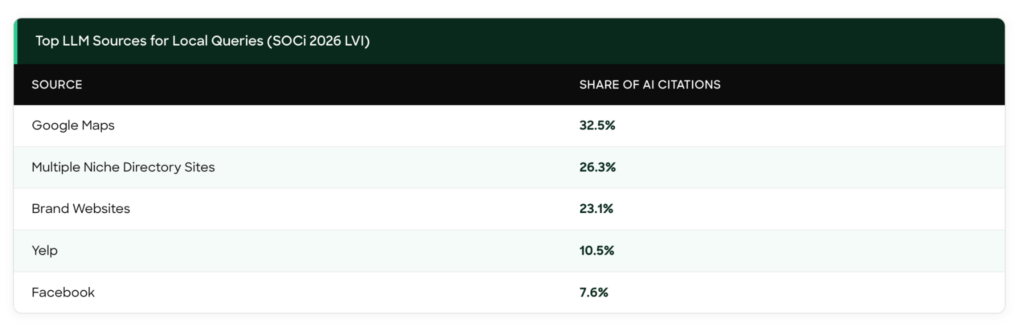
The website still matters when clicks fall. The website is where people go after the listing. After reading positive reviews, 54% of consumers visit the business’s website, up from 32% in 2019. Yet only 40% of local businesses have a dedicated website. A missing website costs customers directly: 18% of consumers who decided against a business said they couldn’t find its website. The site also feeds AI: SOCi found brand websites supply 23.1% of LLM citations for local queries.
Location pages connect the website to the GBP. The page you link from your GBP carries a lot of weight in the map pack ranking factors:
- Keywords in the GBP landing page title tag: #17
- Geographic relevance of content (city or neighborhood): #18
- Keywords in the GBP landing page headings: #20
- Business name, address and phone number (NAP) on the website matching the GBP: #15
Best-in-class brands show how much better location pages can perform. Batteries Plus Bulbs gets 70.3% of its local pages onto page 1 of Google, compared with a 22.6% retail benchmark.
Citations: declining for rankings, rising for AI. Citations (listings of your business details on other sites) keep losing weight in traditional map rankings, dropping about half a percentage point this edition. But Shaw believes AI is showing how foundational they are, and 3 of the top 5 AI Search visibility factors are citation factors. In his words, mentions are the new link for AI SEO. Consistency matters most on the major map platforms: consistency of citations on Google Maps, Bing Maps and Apple Maps ranks #28 for the map pack. Coverage has real gaps, too. SOCi found that only 80.0% of brand locations on Google are also findable on Yelp, and only 53.4% on Facebook. Accuracy follows from consistency: brand profile information was only 68.3% accurate on ChatGPT and 68.0% on Perplexity, but 100% accurate on Gemini, which draws on Google Maps data.
Links: still the backbone of organic rankings. Link signals take three of the top five localized organic factors: quality and authority of links to the domain (#3), and links from industry-relevant domains (#5). For the map pack, local links matter most. Quality links to the GBP landing page rank #25, and links from locally relevant domains rank #26–27. Some older link tactics are losing value. Linking out to authority sites fell 64 places to #177. Shaw’s 2026 recommendations for AI visibility focus on getting onto expert-curated “best of” lists, earning local press and community mentions, and building out listings on major industry directories.
Local search conversion and measurement benchmarks
Rankings get a business seen, but it doesn’t get it chosen. Most local reporting begins at the contact (the call, the form fill, the direction request), which means the searchers who looked and moved on leave no trace in your data.
The benchmarks in this section are a way to see into that blind spot. Use them twice: first as an audit list, to find the profile gaps most likely to be costing you contacts you never knew were in play, and then as a yardstick, since paid search puts a market price on a local lead. That price lets you value what organic visibility is earning and judge whether your own conversion rates hold up for your category.
Decisions happen fast, and many losses are invisible. Most consumers choose a business within 30 minutes, and more than a quarter decide in under five. During their most recent search, 52% looked at a business and chose not to contact it, so the business never knew it was considered. The most common reasons for ruling a business out:
- Negative reviews: 33%
- Unclear pricing or no offers: 32%
- Low star rating: 30%
- No or few reviews: 24%
Neglect is a major factor. 62% of consumers who ruled out a business cited at least one sign of inactivity, such as old reviews or missing information.
What wins the contact. When BrightLocal asked what decided which business consumers contacted, the top answers were clear and complete information (32%), the most or best reviews (30%), and clear pricing or a deal (29%). Speed also mattered: 22% chose a business partly because it responded quickly to their first inquiry. Consumers expect businesses to manage this actively: 96% think it’s important for a local business to manage how it appears online.
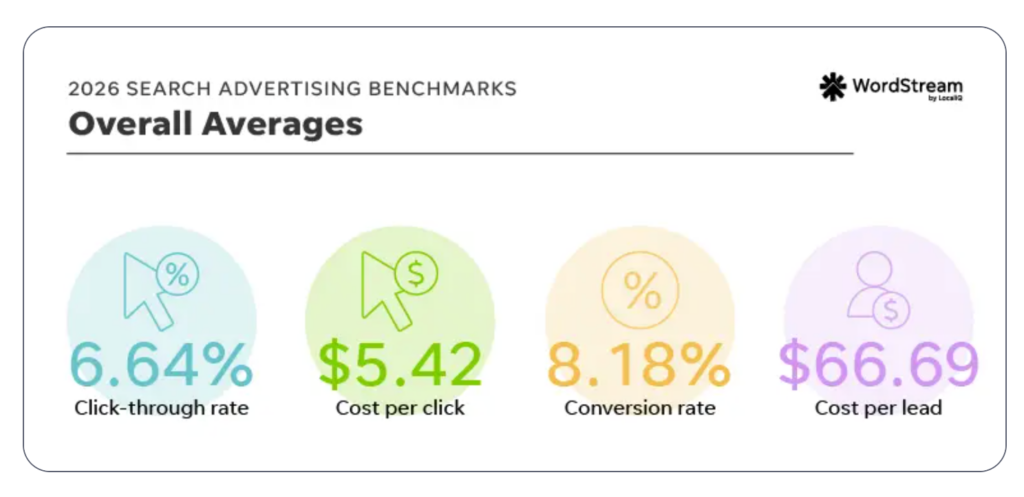
Paid search benchmarks give a reference point for conversion. WordStream by LocaliQ’s 2026 benchmarks, based on more than 13,000 US search campaigns, put the average Google Ads click-through rate at 6.64%, average cost per click at $5.42, and average conversion rate at 8.18%. The average cost per lead for search advertising in 2026 is $66.69. Conversion rates improved in 87% of industries. These figures count calls and form fills as conversions, and local, urgent categories convert best: Animals & Pets at about 16.2% and Automotive Repair at about 15.5%.
AI traffic is small but converts well. Adobe data shows traffic from AI sources converted 42% better than non-AI traffic in Q1 2026, rising to 54% by May. The volume is still small, so treat this as an early signal rather than a channel to plan around.
Measure what the SERP now hides. With most searches ending without a click, website sessions understate local SEO results. A practical 2026 measurement stack:
- Grid-based rank tracking. Map pack rankings vary block by block and hour by hour. Being open at the time of the search is the #5 map pack rank factors, so rankings shift with opening hours.
- GBP actions by location. Track calls, direction requests, website clicks and bookings for each location, not just impressions.
- Local landing page performance. Measure organic landing sessions and conversions, and compare your page-1 rate against SOCi’s 2.7% average.
- AI visibility checks. Monitor whether each location is recommended by Gemini, ChatGPT and Perplexity, and whether the details they show are correct. SOCi’s recommendation benchmarks are 11.0%, 1.2% and 7.4% respectively.
- Call tracking and response time. Clear, quick contact paths drive decisions, so measure answered calls and time to first response alongside lead volume.
Online reputation and reviews
Reviews have gone from a nice-to-have to a gate a business has to pass twice: once with Google and once with the customer.
On the ranking side, Google counts review volume and rating toward prominence, one of its three local ranking factors, and the words customers use in reviews help it match a profile to specific service searches. On the conversion side, consumers now read reviews more than ever, set higher minimum ratings, and discount anything more than a few months old. A business can rank in the local pack and still lose the click to a competitor with a stronger, fresher review record, and searchers who filter by star rating may never see it at all.
At the same time, reviews are spreading across more platforms, including AI tools that summarize them. That widens the SEO job. AI-generated answers draw on review content from Google and third-party sites when they describe or recommend local businesses, so a review profile now shapes whether and how a business appears there as well as in the map pack. A steady flow of recent, detailed reviews on the platforms that matter in a category is now a core local SEO input, and no longer a reputation task that sits beside it.
How consumers use ratings, review volume, recency, and review content
Nearly everyone reads reviews, and more do it every time. BrightLocal’s 2026 Local Consumer Review Survey of 1,002 US adults found that 97% of consumers read reviews for local businesses. The share who “always” read them jumped to 41%, up from 29% the year before. SOCi’s 2026 Local Discovery Index found much the same: 99% of US consumers read reviews at least some of the time before a first visit, and 68% always or most of the time.
Reviews move people in both directions:
- 85% say positive reviews make them more likely to use a business, and 77% say negative reviews make them less likely.
- 49% trust online reviews as much as recommendations from people they know.
- 93% have made a purchase after reading reviews, and 27% have spent more than $1,000 that way.
Ratings: the minimum is rising fast. 92% of consumers care about star ratings when choosing a business, and the bar keeps moving up:
| Minimum rating required | 2025 | 2026 |
| 4.0 stars or higher | 55% | 68% |
| 4.5 stars or higher | 17% | 31% |
Perfection isn’t required: only 10% will use only businesses with five stars. AI tools apply a similar bar. SOCi found that locations recommended by AI platforms average 4.2 to 4.3 stars, which amounts to a practical threshold for being included. For comparison, multi-location brands average 4.2 stars on Google but only 3.2 on Yelp.
Volume: consumers want enough reviews to trust the average. 47% of consumers won’t use a business with fewer than 20 reviews, and only 9% will consider one with five or fewer. Too few reviews was the reason 33% of consumers gave for ruling out a business they found online. For reference, multi-location brand locations average 137.1 Google reviews each.
Recency now matters more than volume. Consumers want reviews that reflect the business as it is today:
- 74% only care about reviews from the last three months.
- 32% look for reviews from the last two weeks, up from 20% last year, and 18% are only swayed by reviews from the past week.
- In SOCi’s data, 55% of review readers say the most recent reviews matter most, compared with 26% who prioritize total review count, a gap of more than two to one.
Stale reviews cost customers: 21% chose not to contact a business because its reviews were out of date.
Content: consistency beats any single glowing review. When BrightLocal asked what makes a review trustworthy, consumers ranked:
- The review is backed up by other reviews with similar sentiment: 56%
- It describes a positive experience: 46%
- It was posted within the last month: 44%
- It has a high star rating: 42%
- The owner has responded: 37%
An appealing photo or video with the review matters to 36%. Length matters least: only 26% value long, detailed reviews. SOCi adds that 30% of review readers focus on specific details, such as photos or descriptions of the service or food.
AI summaries are becoming the first thing people read. 82% of consumers read AI-generated review summaries, and 23% would rely on the summary alone to make a decision. Only 18% skip them. Because summaries condense many reviews into one takeaway, consistent sentiment across reviews matters even more.
Where people read reviews and how they compare businesses
Google leads, but consumers now use many sources. The average consumer uses six different review sites when choosing a business. Google’s share as a review source fell from 83% in 2025 to 71% in 2026. Other sources grew fast:
- AI tools like ChatGPT rose from 6% to 45%, becoming the third most-used source for local recommendations.
- Apple Maps nearly doubled, from 14% to 27%.
- Facebook, Tripadvisor, BBB, Trustpilot, Healthgrades, Yellow Pages and Angi all gained users.
- Local news sites fell sharply, from 48% to 29%.
SOCi also found that monthly use of review sites rose to 36% of US consumers in 2026, up from 19% in 2025.
Where reviews get written. The platforms where consumers leave reviews follow a similar order: Google (45%), Facebook (34%), Yelp (24%), Apple Maps (17%), and Tripadvisor and BBB (16% each). Yelp punches above its weight in AI answers: it accounts for 10.5% of the sources LLMs cite for local queries, even though multi-location brands respond to only 3.1% of their Yelp reviews.
Reviews are how consumers check everything else. SOCi describes local discovery as a “verification loop”: people find a business on one channel, check it on another, and decide on a third. Reviews dominate that checking stage. Even AI recommendations get checked: 81% of people who use AI for local recommendations take an extra step to verify, and the most common step is checking reviews on Google or another site (33%).
How consumers compare businesses. Shortlists are very short, found Brightlocal. 72% of consumers look at three or fewer businesses before deciding, and 75% used more than one channel in their most recent search. During research, star rating (38%) and number of reviews (37%) are the most important factors after proximity. On review and listing sites, those factors weigh even more heavily: 49% look at review count and 48% at star rating. Across industries, reviews and word of mouth are the top decision factor in five of the eight categories SOCi measured, peaking at 41% for restaurants and bars.
Reviews often lead to more research, not an immediate purchase. After reading positive reviews, 66% of consumers keep researching, while 34% are ready to buy or book. The most common next step is visiting the business’s website (54%), and 37% go on to read more reviews.
Reviews also affect rankings. Whitespark observed review factors rank high for the map pack:
- High Google ratings (4–5 stars): #6
- Number of Google reviews with text: #9
- Review recency: #11
- A steady flow of reviews over time rather than bursts: #14
Review response expectations and the effect of negative feedback
Consumers expect every review to get a reply, and fast. As per Brightlocal’s research, 89% of consumers expect business owners to respond to reviews, and the expected turnaround is shrinking:
| Expected response time | 2025 | 2026 |
| Same day | 6% | 19% |
| By the next day | 18% | 32% |
| Within a week | — | 81% |
Respond to all reviews, and make each reply personal.
- 80% of consumers are likely to use a business that responds to all its reviews, and 42% are unlikely to use one that never replies.
- Responding only to positive reviews (45%) or only to negative ones (47%) wins over far fewer consumers.
- Templated or generic replies put off 50% of consumers.
SOCi’s data points the same way: 72% of consumers are more likely to choose a business that responds to its reviews, all else being equal.
Most businesses fall well short. SOCi also found that multi-location brands respond to only 46.9% of their Google reviews, with an average response time of 4.3 days. On Yelp, it’s 3.1% of reviews at 4.5 days. More than half of all consumer feedback to these brands goes unanswered. The best performers show what’s possible: Batteries Plus Bulbs responds to 98.3% of its Google reviews in an average of 0.6 days.
Responses seem to matter more for winning customers than for rankings. In Whitespark’s survey, “owner responses to most reviews” ranks only #122 as a map pack factor, and putting keywords in owner responses ranks #182.
Negative feedback is costly, but it can be recovered.
- 33% of consumers chose not to contact a business because of negative reviews, making it the top reason in BrightLocal’s study. 65% were put off by at least one review-related reason.
- In SOCi’s data, negative reviews or low ratings were behind 37% of decisions not to visit a business found online.
- A good response can turn this around: 65% of consumers would be more likely to return after a business responded helpfully to their negative review, and 87% say they’d likely revise a negative review to a positive one after a helpful response.
- 19% of review readers say how a business handles negative reviews is what matters most to them.
Fake reviews and review rules. Google blocked or removed more than 292 million policy-violating reviews in 2025, while publishing more than 1 billion. The rules tightened further in 2026:
- In April 2026, Google banned merchants from having staff solicit a set number of reviews, or reviews that mention staff names or other specific content.
- When Google detects a spike in spam reviews, it now removes the fake content, pauses new reviews, alerts the owner, and shows consumers a public banner explaining the pause.
- 11% of consumers were offered an incentive to write a positive review, which breaks the FTC’s rule on fake and incentivized reviews.
Consumers support strong enforcement: 97% think businesses should face consequences for fake reviews, and 57% say those businesses should be banned from review platforms.
Asking for reviews works. 78% of consumers were asked to leave a review in the past year, and 83% of those asked went on to leave one. The share who say they’ll “always” leave a review when asked rose to 28%, from 16%.
2026 guidance at a glance
- Aim for 4.3+ stars and 20+ recent reviews on Google. That clears most consumers’ minimums and matches what AI tools recommend.
- Ask for reviews continuously, not in campaigns. Most consumers only trust reviews from the last three months, and Google flags sudden spikes.
- Reply to every review within 24 hours, in a personal voice. Resolve negative reviews in the reply, since most reviewers will update theirs.
- Build reviews beyond Google. Consumers use six sources on average, and AI tools draw on Yelp and other sites.
- Follow the platform rules. No incentives for positive reviews, no staff-name requests, and no review quotas for staff.
- Track recency, response rate and response time alongside star rating and review count.
Local social media
Social media has become a local search channel in its own right. People use Facebook, YouTube, Instagram and TikTok to find nearby businesses, check what a place is really like, and decide whether to go. In 2026, more than half of US consumers used social media to find a local business in the past month, and most say a post or video has directly turned them into a customer.
For SEO, that means local search optimization no longer ends at Google. Each platform runs its own search, with results shaped by the same things local SEOs already manage elsewhere: accurate business details, location signals, and the words used in profiles, captions, and video descriptions. A social profile works as another business listing, so the name, address, hours, and categories should match the Google Business Profile and the website.
The work also feeds back into Google, where social profiles and videos can rank for brand and local queries and take up space on the results page that a business would otherwise have to win with its own site. They help build a brand’s digital footprint and authority. A business that is easy to find on Google but absent or inconsistent on social platforms is leaving a growing share of local discovery to competitors.
How consumers discover and evaluate nearby businesses on social platforms
Social is now the second-largest local discovery channel. SOCi’s 2026 Local Discovery Index (1,000+ US consumers) found that 55% used social media to look for local business recommendations in the last 30 days, second only to search engines. Monthly social network use for local discovery has nearly doubled in two years:
| Share of US consumers using social networks at least monthly | 2024 | 2025 | 2026 |
| All consumers | 40% | 73% | 78% |
Overall, 64% have used social media to search for local recommendations, such as posts or videos about restaurants or attractions. SOCi argues that the line between social and search has effectively dissolved: consumers search on social platforms, while search engines and AI systems use social profiles and content as signals of relevance and authenticity.
Which platforms people use. Among consumers who use social media to find local businesses:
| Platform | Share using it for local discovery |
| 73% | |
| YouTube | 69% |
| 67% | |
| TikTok | 50% |
| X | 33% |
| Snapchat | 29% |
| 25% | |
| 24% | |
| Nextdoor | 8% |
TikTok skews much younger, and it is the one platform Gen Z prefers over Facebook for local discovery. As a review source specifically, BrightLocal’s 2026 survey found 37% of US consumers use Instagram and 29% use TikTok to find local business reviews.
Age makes a big difference. 67% of Millennials and 60% of Gen Z used social media to find a local business in the last 30 days, compared with 44% of Gen X and 20% of Boomers and older.
Where social is the starting point. Search engines are still the most common place to begin, but social leads in some categories. 20% of people looking for a bank, financial advisor or insurance provider start on social media, the highest rate of any category. For apartments it’s 15%, and for hotels 14%.
Social is how people check a business before going. SOCi describes local discovery as a “verification loop”: people find a business on one channel, check it on another, and decide on a third. Social plays a big role in the checking stage. The top reasons consumers look up local businesses on social media are:
- To see what the place is like before visiting: 43%
- Because the content is useful or informative: 42%
- To see the menu, products or offerings: 38%
- To see what other users think: 35%
- Because the content is entertaining: 33%
- For deals, promotions or events: 25%
- For updates about hours, closures or changes: 18%
Visuals matter here. Visual content is the top decision factor for 43% of people choosing an apartment or rental, and it’s cited by 28–30% of people choosing restaurants and hotels.
Social also checks AI answers. After an AI tool recommends a local business, 20% of AI users look at the business’s social media content to learn more, making it the second most common verification step after checking reviews (33%).
The role of recommendations, creator content, and community groups
Peer and creator content has moved into social and video. BrightLocal’s 2026 survey found video platforms rising as review sources, with YouTube, Instagram and TikTok all gaining ground. Reviews from influencers and everyday users give consumers quick, visual insight into businesses. TikTok’s Local Explorer program, which rewards people who review local places, works much like Google Local Guides.
What content people respond to. Consumers favor content that feels local and real:
- 15% follow local businesses because they like content that feels local, such as store managers, community events and neighborhood posts.
- 12% prefer content that feels like it was made by someone like them.
- 55% of consumers scroll with the sound on, rising to 72% for Gen Z, so video needs to work both with and without sound.
Sprout Social’s 2026 data points the same way: human-made content is users’ top priority.
Community groups and neighbor recommendations. Neighborhood platforms are built around recommendations. In September 2026, Nextdoor launched Local Faves, a discovery hub built on recommendations from verified neighbors. Nextdoor says organic business recommendations already make up nearly 30% of all content on the platform. Its own surveys (which are undated) report that 79% of users were influenced by a recommendation on Nextdoor to visit a business or use a service, and 62% have discovered a small business there.
Facebook Groups serve a similar purpose at a larger scale. In 2026, Meta built a Reddit-style product called Forum from Facebook Groups content, drawing on years of local recommendations and community conversations. Reddit is also part of the mix: 25% of consumers who use social for local discovery use Reddit.
Recommendations still beat everything else. A recommendation from a friend or family member was a top-three decision factor for 25% of consumers in their most recent local search. BrightLocal found that 49% of consumers trust online reviews as much as recommendations from people they know.
Social feeds AI answers. Facebook accounts for 7.6% of the sources LLMs cite for local queries. SOCi notes that Facebook remains an important data source for search and AI systems even as its role as a review platform declines. The gap is linking: only 43.0% of multi-location brand locations link their social profiles on their Google Business Profile.
Social interactions that lead to visits, inquiries, or purchases
Social converts, across most age groups. 59% of US consumers say a social post or video has directly made them a customer of a local business. By group:
| Group | Share who became a customer from a social post or video |
| Millennials | 70% |
| Gen X | 54% |
| Gen Z | 52% |
| Boomers and older | 22% |
| Household income $100K+ | 70% |
| Household income 50K–99K | 53% |
| Household income under $50K | 52% |
Three of the four generations are above 50%, so social is not a niche channel for young consumers; it drives real business across the market.
Unanswered messages cost customers. Responsiveness on social has a direct effect on whether people buy:
- 29% of consumers expect a reply when they ask a question on a business’s social post, and 19% expect replies to both questions and general comments.
- After an unanswered direct message, 38% would try another way to reach the business, and 23% would go to a competitor instead.
- 5% would leave a negative review.
- Sprout Social’s 2026 data found 73% of consumers say they’ll switch to a competitor if a brand doesn’t respond on social media.
What brands are doing. SOCi’s 2026 Local Visibility Index benchmarks for multi-location brand locations on Facebook:
| Metric | Benchmark |
| Followers per location | 360.3 |
| Posts per month | 4.7 |
| Engagements per post | 5.0 |
| Engagement rate | 1.40% |
Brands are posting less but getting more engagement: posting frequency and follower counts fell year over year, while engagement rates nearly tripled. Local content outperforms reposted corporate content. 26.8% of locations use “waterfall posting” (copying the parent brand’s posts to local pages), and SOCi recommends localized posts instead because they drive better engagement.
Platform context. Instagram reached 55.1% of online adults in the past month, compared with 36% for TikTok (excluding China), according to GWI data in DataReportal’s Digital 2026 report. TikTok users spend more time, though: 1 hour 37 minutes a day, compared with 1 hour 13 minutes on Instagram.
2026 guidance at a glance
- Treat social profiles like listings. Keep hours, menus, pricing and offerings current, because 38% check them on social before visiting.
- Show the real place. Post photos and video of the actual location, staff and work, since “seeing what it’s like” is the top reason people look up a business.
- Post locally, not from corporate. Localized posts drive more engagement than reposted brand content.
- Reply to questions and DMs quickly. Nearly a quarter of consumers will go to a competitor after an unanswered message.
- Encourage customers and local creators to post. Video reviews on YouTube, Instagram and TikTok are growing as review sources.
- Join community groups as a helpful neighbor, not an advertiser. Build a presence on Nextdoor, local Facebook Groups and city subreddits.
- Link your social profiles to your GBP. Fewer than half of locations do, and it connects your search and social signals.
Local mobile behavior
Local search is mostly mobile search. Nearly three-quarters of local business searches now start on a phone, decisions happen within minutes, and the most valuable actions (calling, getting directions, checking hours) happen on a small screen, often on the move. A slow or clumsy mobile experience costs businesses customers.
For local SEOs, this changes where the effort should go. On a phone, the Business Profile is often the whole interaction: a searcher sees the local pack, taps to call or get directions, and never reaches the website. That makes profile accuracy as important as anything on the site. Wrong hours, a dead phone number, or a misplaced map pin loses the customer at the last step.
Mobile results are also tied closely to where the searcher is standing, so rankings shift from one neighborhood to the next, and a single rank check from the office says little about what customers see.
Mobile’s share of local discovery
Most local searches start on a phone. BrightLocal’s 2026 Consumer Search Behavior study found that 73% started their most recent local business search on a mobile phone, compared with 19% on a computer and 8% on a tablet. Mobile leads in every age group:
| Age group | Mobile | Computer | Tablet |
| 18–29 | 71% | 19% | 9% |
| 30–44 | 86% | 12% | 3% |
| 45–60 | 77% | 15% | 8% |
| Over 60 | 57% | 33% | 11% |
| Overall | 73% | 19% | 8% |
Searchers aged 30 to 44 are the most mobile-first. Even among people over 60, more than half start on a phone.
Local search is more mobile than the web overall. General web traffic figures for 2026 vary widely depending on how they’re measured. StatCounter put mobile at about 51.5% of global page views in June 2026, while Similarweb estimated 66.55% of global web traffic came from mobile in August 2026. Either way, local search is well above the web average, which is why it’s recommended to track mobile rankings separately from desktop: a business’s position can differ significantly between the two.
Mobile searches mostly begin on Google. 52% of consumers started their most recent local search on Google Search and 9% on Google Maps, and 71% used Google Search at some point. But 75% used more than one channel. People switch between apps on the same phone: Google, Maps, social media (30%), AI tools (23%) and review sites (19%).
Maps is a daily mobile habit. Google Maps has more than 2 billion monthly users. SOCi’s 2026 Local Discovery Index found 59% of US consumers use mapping apps at least monthly, and 40% used one to look up a local business in the last 30 days. For some categories, Maps is the starting point: 25% of people looking for a gas station start in a mapping app rather than a search engine. Google’s new Gemini-powered Ask Maps, launched in March 2026, now lets users ask complex, conversational questions about places and get personalized recommendations.
On-the-go searches and actions such as calling or requesting directions
Mobile decisions are fast. 75% of consumers decide which business to use in under 30 minutes, and 28% decide in under five. Shortlists are short too: 72% look at three or fewer businesses, and only 1% look at more than ten.
Intent makes a big difference. People who are ready to act move fastest:
| Search intent | Decided in under 1 hour | Decided in under 5 minutes | Contacted the first result |
| Ready to contact or visit, just needed to find a business | 91% | 32% | 22% |
| Checking details of a business they already had in mind | 87% | 40% | 27% |
| Researching costs or options, not ready to contact anyone | 72% | 21% | 11% |
Speed varies by industry, too. Food and drink decisions are the quickest, followed by retail and home or garden services. Professional services take the longest, but even there, only 10% of people spend more than an hour researching.
What mobile searchers need in the moment. On the go, the details that matter are practical ones. SOCi found that among consumers who couldn’t find information they needed online:
- 57% were looking for pricing
- 50% for current or holiday hours
- 43% for whether a product or service was available or in stock
- 35% for wait times or appointment availability
- 28% for parking or accessibility
Missing answers cost business: 63% of consumers have stopped being a customer because they couldn’t find information they needed.
Wrong hours hurt twice. Accurate hours matter for both customers and rankings. 49% of consumers would be unlikely to visit a business again after finding its hours listed incorrectly. In Whitespark’s 2026 Local Search Ranking Factors survey, experts rank “business is open at the time of the search” as the #5 map pack ranking factor. Shaw notes that a business can rank #1 while open, start slipping in the last hour before closing, and be replaced by open competitors once it closes.
Calls and directions are the core mobile actions. Direction requests and clicks to call are both counted as ranking signals, at #41 and #57 respectively in Whitespark’s survey. When consumers were asked what made them choose a business, clear and complete information (hours, address, phone) ranked first at 32%, and 22% chose a business partly because it replied quickly to their first inquiry. BrightLocal’s advice is to remove friction: click-to-call, a booking button and a map link all shorten the path from finding a business to choosing it.
Proximity matters most on Maps and in categories people need right away. Being nearby is the top research factor overall (44%), and it matters even more to Google Maps users (49%). It rises to 48% for both food and drink and health and medical businesses.
The effect of mobile site speed and usability on conversion
Most of the mobile web still fails Google’s speed test. Google’s Core Web Vitals measure how fast a page loads, how quickly it responds, and how stable it is while loading. The HTTP Archive Web Almanac, using Chrome real-user data from July 2025, found that 48% of mobile sites and 56% of desktop sites passed all three Core Web Vitals. That’s up from 32% of mobile sites in 2021, but it still means most mobile sites fail. Loading speed (Largest Contentful Paint) shows the widest gap between mobile and desktop.
Faster mobile pages convert better. The Deloitte and Google study linked a 0.1-second improvement in mobile load time to an 8.4% increase in retail conversions and a 10.1% increase in travel conversions. These speed-to-conversion studies show correlation rather than proven cause, but they consistently point the same way. In a Rakuten 24 A/B test, pages with good loading speed scores produced 53.37% more revenue per visitor and a 33.13% higher conversion rate. Mobile still tends to convert worse than desktop overall: 2026 benchmarks put mobile conversion around 1.8% to 2.5%, compared with 3.5% to 4.0% on desktop, which shows how much room mobile has to improve.
Usability and missing information matter as much as speed. BrightLocal points to specific mobile friction points: slow pages, social profiles without clickable contact details, and images that are hard to see on a small screen. Any of these can push a searcher to a competitor. Not having a website at all is costly: 18% of consumers who ruled out a business said they couldn’t find its website. In Whitespark’s survey, having a mobile-friendly, responsive website ranks #16 for localized organic results, and page load time ranks #44.
Response speed is part of the mobile experience. On mobile, the conversion often happens after the click, in how fast the business responds. CallRail’s 2026 home services research, as reported by a third party, found that responding to a website inquiry within 60 seconds lifted conversion by 391%. On social, 23% of consumers would go to a competitor after an unanswered direct message.
Mobile traffic from AI tools is growing. Adobe data shows traffic from AI sources converted 42% better than other traffic in Q1 2026, rising to 54% by May. As tools like Ask Maps and AI assistants send more mobile users to business pages, those pages need to load fast and answer questions quickly.
Local visibility in 2026 is won across many touchpoints at once: the map pack, organic results, reviews, social feeds, and increasingly the AI answers that draw on all of them. The data points in one direction: consumers decide fast, shortlist only a few businesses, and rule out anyone whose information is incomplete, outdated or unanswered. The businesses that get chosen are the ones that keep their profiles accurate, earn a steady flow of recent reviews, respond quickly, and deliver a fast, friction-free mobile experience. Those fundamentals aren’t new, but in an AI-shaped, zero-click search landscape, they now decide whether a business is recommended or invisible.