Winning the Recommendation: How Multi-Location Brands Earn Visibility in AI-Powered Local Search

Share


Overview: A Visibility Boost for Brands
Less than a year ago, SOCi’s 2026 Local Visibility Index (LVI) delivered a sobering finding: AI platforms were 3 to 30 times more selective than traditional local search, and fewer than half of the brands that led in Google also led in AI. For most multi-location brands, AI visibility was the exception, not the expectation.
This year’s preview of the 2027 LVI shows that the picture has changed fast. Across 3,000 brands in 44 industries, the average brand now has 36.1% of its locations recommended in the top five positions of AI results, up from 7.0% last year. That puts AI recommendation on par with the Google 3-Pack (35.9%) and Yelp page one (37.1%). AI has moved from a frontier channel to a core platform for local discovery.
But more visibility has not made it easy to win. Recommendation depends on a small set of sources that AI engines trust, on data that is accurate at every location, and on ratings and review volume that clear a rising bar. And because AI recommends locations rather than brands, results are uneven: nearly 90% of brands are visible at some locations and invisible at others.
|
36.1%
of brand locations recommended by AI, up from 7.0%
|
90.7%
overall data accuracy on Gemini, the most accurate engine
|
~0.25
star gap between recommended and at-risk locations
|
3
sources (website, Google Maps, Yelp) that dominate citations
|
The Shift: AI Is Now Inside Every Channel
In the last twelve months, consumer use of AI has changed dramatically. Consumers no longer need to open a native AI app to use AI; it is already built into search, social, commerce, productivity tools, and browsers. SOCi’s 2026 Local Discovery Index found that 52% of consumers used AI to find a local business in the last 30 days, up nearly sixfold in a year, and 39% say they use it more than they did last year.
Three developments frame the research that follows.
- The AI landscape has diversified. Among native AI tools, ChatGPT still leads, but it no longer dominates. Gemini has grown into a strong second, and Claude, up 180% in unique visitors in the second half of this year, is now third. Some 29 million people use all three. Audiences overlap heavily, yet a brand’s visibility in one tool does not guarantee visibility in the others.
- AI is now a core feature of search. AI Overviews appear for more than 40% of all searches, and Google invites users to continue in AI Mode and, now, in Ask Maps, a conversational local experience in Google Maps. All three are powered by Gemini. Meanwhile 95% of ChatGPT users also use Google. These surfaces are converging, not trading places.
- AI results are not search results. An AI Overview does not always show the same businesses as the Google 3-Pack. The 3-Pack hands users options to evaluate, ranked by well-understood factors and sourced entirely from Google Business Profiles. AI composes an answer from many sources, and it may name entirely different businesses.
Queries are changing too. AI prompts run roughly four times longer than the average search query, with more criteria attached. And most engines split a single prompt into a series of sub-queries (a technique known as query fan-out) before assembling one answer. A request for an “Italian restaurant near me with vegan options that seats large groups” becomes a handful of searches on cuisine, diet, group size, ratings, and neighborhood. Every one of those is another chance for a location to be left out, making visibility analysis a potentially complex endeavor.
Measuring Local Visibility in AI
To benchmark AI visibility, we first had to define it. Local visibility in AI has two layers. In the informational layer, brands surface as authoritative sources for questions of general interest, drawing on citations from sources such as Wikipedia, Reddit, YouTube, and LinkedIn. In the transactional layer, AI recommends specific stores, offices, restaurants, and service providers, drawing on directories, mapping apps, vertical sites, and social sites. A brand’s website bridges both layers: the corporate site answers brand-level questions, while local pages power location-specific ones. This research focuses on the transactional layer, where visibility leads directly to foot traffic and revenue.
Next, the ecosystem. Every engine combines training data, which supplies general knowledge, with live grounding, which supplies local facts. Marketers can influence only the grounding sources, and those differ by engine.
| Engine | Local grounding | What it draws on |
|---|---|---|
| ChatGPT | Yelp | Bing search index; ChatGPT’s own index; Yelp listings and reviews; probably crawled Google data. |
| Gemini | Google Maps | Google-ranked search results; Maps contact info, reviews, and photos. Also powers AI Overviews, AI Mode, and Ask Maps. |
| Claude | Google Maps | Brave search index: the business sites, directories, and review pages Brave has crawled. |
Table 1. Local grounding by engine. Training data supplies general facts; only grounding sources can be influenced by brands.
Dataset and method
Our 2027 LVI preview draws on 8.5 million data points, covering 3.0 million local business results and 1.4 million AI citations, across approximately 3,000 brands in 44 industries. For each brand we benchmark five AI performance indicators: recommendation rate, profile completeness, profile accuracy, average rating, and web sources cited.
To measure visibility consistently, we use a single prompt format at scale: “Recommend 10 local businesses of type X in market Y.” A location in positions 1 to 5 is counted as likely to be recommended. A location in positions 6 to 10 is at risk of not being recommended. A location not listed is invisible. This method does not capture top-of-funnel questions (“What kind of TV should I buy?”), but it captures the queries that lead to local transactions.
INSIGHT 01
Brand Visibility Has Improved Dramatically
The share of brand locations recommended in positions 1 to 5 rose from 7.0% to 36.1% across all engines, a brand-level mean across 2,998 brands. AI recommendation now sits at parity with the Google 3-Pack and Yelp page one.
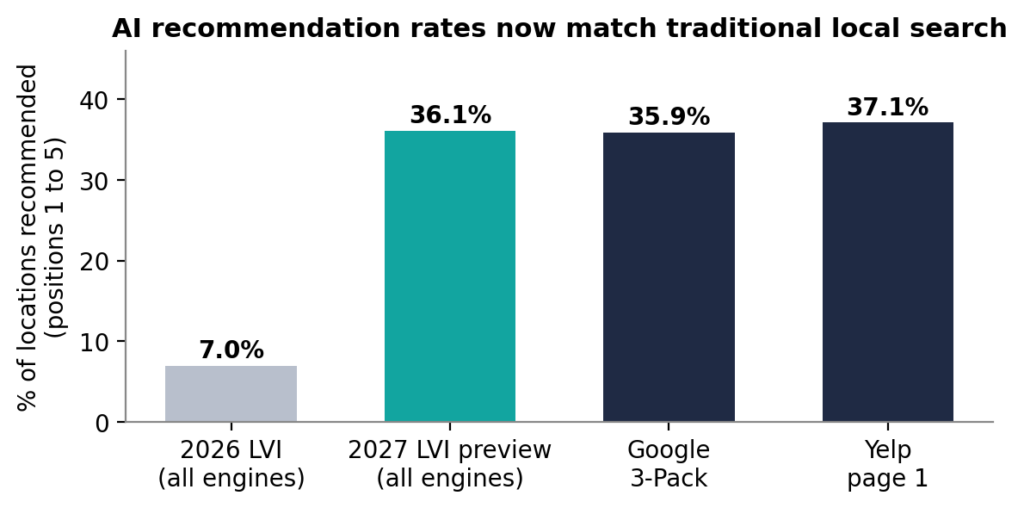
Figure 1. Share of a brand’s locations recommended in AI positions 1 to 5, compared with Google and Yelp.
Which engine a brand is on matters far less than which industry it is in. The three engines differ by just 1.0 point on average, but recommendation rates vary by 32.6 points across industry and engine, from 17.1% to 49.7%. That is 33 times more variation by industry than by engine. The leading engine changes by industry, and no engine is best everywhere. Retail brands are recommended nearly three times as often as Property Management brands on every engine.
INSIGHT 02
Accuracy Is Up, but Not Perfect
We measured field-level accuracy against Google Maps as the source of truth. Gemini, which is grounded in Maps, leads overall at 90.7%. Claude is comparable at 88.1%, and ChatGPT, at 85.0%, has improved on last year, when business information on ChatGPT was only about 68% accurate. Names and addresses are close to solved. The fields that drive many actions are not.
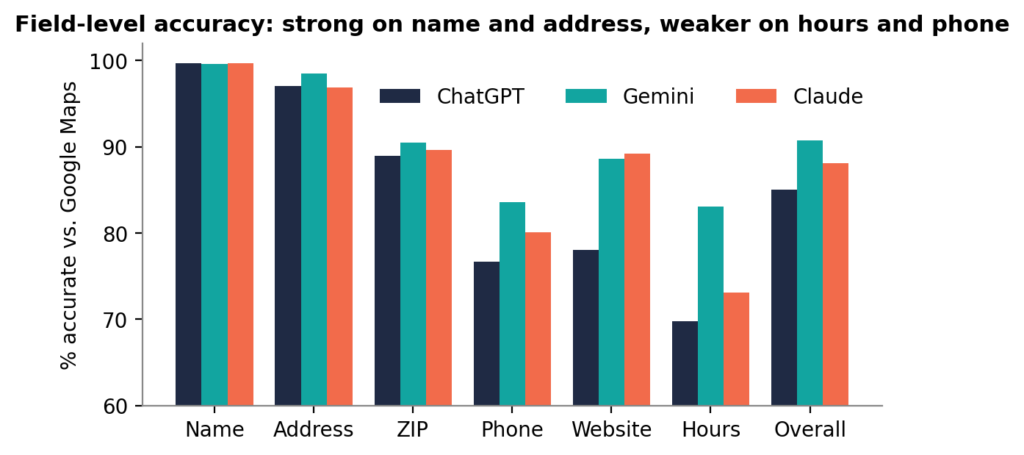
Figure 2. Accuracy by field and engine, measured per location against Google Maps.
| Field | ChatGPT | Gemini | Claude |
|---|---|---|---|
| Name | 99.7% | 99.6% | 99.7% |
| Address | 97.0% | 98.5% | 96.9% |
| ZIP | 88.9% | 90.5% | 89.6% |
| Phone | 76.7% | 83.6% | 80.1% |
| Website | 78.0% | 88.6% | 89.2% |
| Hours | 69.8% | 83.1% | 73.1% |
| Overall | 85.0% | 90.7% | 88.1% |
Table 2. Field-level accuracy. Statistics are per location, not per brand.
Hours are the weakest field on every engine, and on ChatGPT fewer than 70% of locations get them right. A wrong phone number or closing time breaks the path to conversion, and our Local Discovery Index found that two-thirds of AI users have already been given wrong information about a local business.
INSIGHT 03
Ratings Are Still the Price of Entry
High ratings remain a gating factor for AI visibility. Every engine puts better-rated locations higher, and the gap between a recommended slot and an at-risk slot is roughly a quarter of a star. A 4.3 or better takes the top spot, and below 4.2 a location is rarely recommended at all.
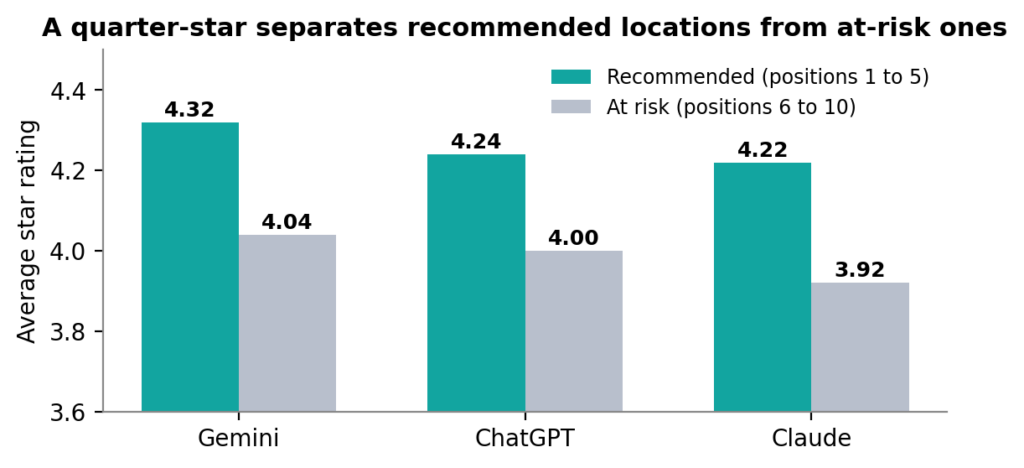
Figure 3. Average star rating by rank tier and engine.
Volume can offset a modest rating shortfall. A location with 4.3 to 4.6 stars and a high review count can beat a location with 4.6 to 5.0 stars and few reviews. Recommended locations average 150 to 190 reviews, while locations falling below the threshold average 90 to 135. How much volume it takes varies by engine (and industry).
| Engine | Review multiple needed to offset a 0.2-star deficit | Relative sensitivity |
|---|---|---|
| ChatGPT | 1.04x | High |
| Claude | 1.14x | Moderate |
| Gemini | 1.64x | Low |
Table 3. Review volume needed to offset a 0.2-star rating deficit.
INSIGHT 04
Three Citation Sources Dominate
To understand what AI reads, we ranked the web sources it cites by Citation Weight, which combines breadth (the share of brands for which a source is cited) with depth (the median share of each brand’s locations that it covers): Weight = √(Breadth × Depth). Three sources stand apart. Google Maps (99.7), the brand’s own website (98.0), and Yelp (95.5) are cited for nearly every brand at most of its locations. The drop to fourth place, Yellow Pages at 72.1, is the largest gap in the table.
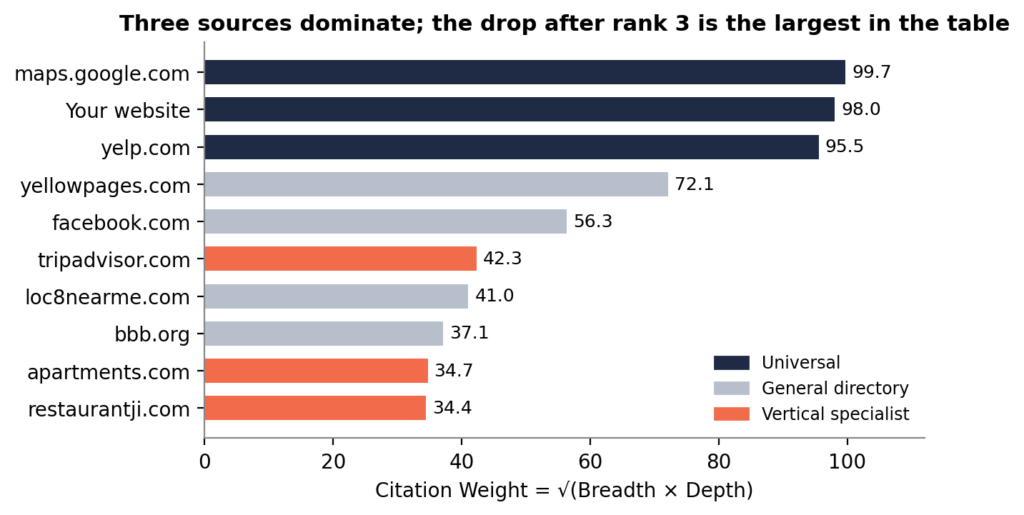
Figure 4. The ten most-cited sources by Citation Weight.
Below the top three, the landscape splits in two. General directories such as Yellow Pages and Facebook are cited broadly but shallowly. Vertical specialists are the reverse: narrow but deep. Booking.com is cited for just 3.2% of brands but 85.7% of those brands’ locations, and the Better Business Bureau is cited for 86.2% of brands but only 16.0% of their locations. Specialists decide visibility inside a single industry.
Each engine and industry reads differently
Citation behavior follows each engine’s grounding. Gemini relies almost entirely on Google Maps and the brand’s website and falls off sharply after rank two. Claude is also heavily dependent on Google Maps but cites Yelp frequently. ChatGPT, grounded in Yelp, draws on the most sources per location and reads the most low-tier aggregators.
When the data is broken down by industry, different citation patterns emerge. Google, Yelp, and business websites dominate any category, but differentiation opportunities exist with vertical sites and general directories that many brands neglect.
| Industry | Brands | What sets its citation profile apart |
|---|---|---|
| Retail | 667 | Breadth stays high through the top 10 (e.g., loc8nearme.com at 5th, 69.4), offering differentiating opportunity |
| Local Services | 932 | Least specialized: top six sources match the national top six |
| Food & Beverage | 439 | Your website, Yelp, and Google Maps lead; TripAdvisor (88.1) and Restaurantji (80.9) follow, then delivery platforms like DoorDash |
| Financial Services | 337 | bankbranchlocator.com ranks 30th nationally but 5th here; Yelp is weaker (81.6) than in other industries |
| Property Management | 376 | Most specialized: seven of the top ten are category-specific, and apartments.com (90.8) sits within two points of Yelp |
Table 4. Notable citation patterns by industry. Breadth and depth recomputed within each industry.
The Playbook: What Brand Marketers Can Do
1. Remember that AI visibility is won one location at a time
AI recommends locations, not brands, and almost no brand is uniformly visible. In our data, 89.7% of brands get mixed results across their own locations: 6.8% have every location recommended somewhere, and 3.5% have no location recommended anywhere. Every prominent profile for every location has to be complete, accurate, and up to date.

Figure 5. Distribution of brands by consistency of location visibility.
2. Treat brand visibility and local visibility as different jobs
Both matter, but they are won with different work. Brand visibility means owning the whole conversation in your category: if you sell men’s suits, every question about men’s suits is a target, transactional or not. It is won with authority, content, and citations across the open web. Local visibility means getting chosen over competitors, market by market. It is won with accurate, complete structured data on your website and top directories for every location, and with the clearest signals of peer approval: ratings and reviews. Only local visibility is measured location by location.
3. Get the three dominant properties right first
Your own website’s local pages, Yelp, and Google Business Profile account for the great majority of what AI cites. Local pages and the rest of your website are the single most-cited source. Yelp grounds ChatGPT and is heavily cited by Claude. Maps grounding is nearly the whole of a Gemini answer. Everything below the top three has only marginal influence by comparison.
4. Prioritize according to the F.A.C.T.S.
Freshness, Authority, Consistency, Trust, and Semantic Relevance describe what AI engines look for. In practice, that means three priorities:
- Fix the top three sources at every location. Website local pages, Yelp, and Google Business Profile should be complete, accurate, and current for every location.
- Drive both rating and review volume. A high star rating gets a location considered; volume breaks ties against competitors.
- Optimize to your brand’s citation profile. Look at Facebook and the key general and vertical sites where your brand can gain strong coverage.
This is exactly the work an agentic workforce does at scale: continuously auditing and correcting every location across every source AI relies on, so teams can focus on strategy instead of upkeep.
In Summary
AI visibility has gone from rare to routine in a single year, and the brands now being recommended got there by strengthening the signals AI depends on rather than by chasing AI as a separate tactic. Accurate data on three dominant sources, ratings above the threshold backed by review volume, and consistency across every location are the price of entry. Beyond that, the winners are the brands that treat visibility as a system to operate continuously, location by location.
The full 2027 Local Visibility Index, with complete AI results and updated benchmarks for search, reputation, and social, will be released in January. Request your own Local Visibility Index audit at soci.ai/insights/lvi to see how your locations compare.
About the data
The 2027 LVI preview analyzes AI recommendations from ChatGPT, Gemini, and Claude for approximately 3,000 multi-location brands in 44 industries, yielding 8.5 million data points, 3.0 million local business results, and 1.4 million AI citations. Recommendation rates use the prompt “Recommend 10 local businesses of type X in market Y,” counting positions 1 to 5 as likely to be recommended. Accuracy is measured per location against Google Maps. AI platform usage figures are from Similarweb Web Intelligence; AI adoption figures are from SOCi’s 2026 Local Discovery Index.
Related Articles